REAL WORLD
A Volatility Trade In Gold
by David S. Landry, CTA
Large moves often follow low-volatility environments. Here's one method of combining volatility indicators and pattern recognition along with trend-following methods to capture a breakout in the 1997 gold futures market.
A simple review of a market chart will illustrate that markets trade in periods of lackluster sideways price action and then abruptly adjust to new conditions by trending to another price level. The goal of many traders is to trade these short-term trends profitably. Technical analysis can aid you in identifying potential trades based on the concept of the market moving from trading ranges to trends.
To demonstrate, I will walk you through a trade in the gold market based on a set of technical indicators. First, let me define the formulas I used for my analysis. Having set up my indicators, let us walk through the steps for making a trade. The first step is tracking volatility. To measure volatility, I used four-, six- and 10-day historical volatility indicators inspired by the volatility work of Larry Connors. I added two additional indicators to the historical volatility indicators. I ran an average of the three by adding each of the four-, six- and 10-day historical indicators together, dividing by 3, then calculating a 12-day exponential moving average (EMA) of that result.
A word of caution. Be careful when developing a derivative (in this case, averaging the three historical volatility readings) and then taking the moving average of that derivative. You may have created a more complex indicator that only introduces additional lag compared with the original indicator. Any time I start deriving formulas from formulas, I use them as supportive indicators and not as primary trading indicators.
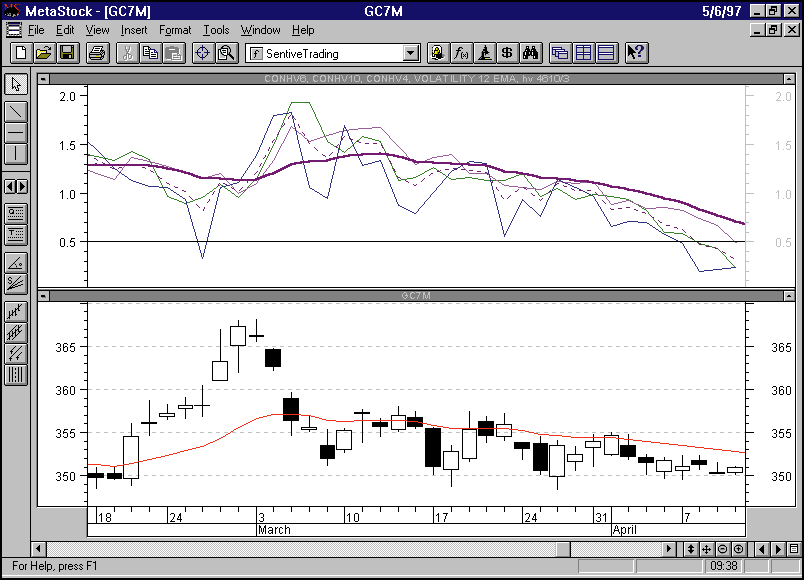
FIGURE 1: COMEX GOLD. On April 11, 1997, note how low volatility readings are. The blue, green and magenta lines represent the four-, six- and 10-day historical volatility readings, respectively. The dotted purple is the one-day average of the three indicators and the solid purple line is a 12-day exponential average of the one-day average.