INDICATORS
New Applications
Improve on certain directional movement index signals such as identifying the start of a trending move and picking market tops and bottoms.
Directional movement index (DMI) is a long-accepted and popular technical indicator created by J. Welles Wilder to establish the existence of a trend in a market using three lines — ADX, +DI, and -DI. This article shows that the same three lines can be used to significantly improve on certain DMI signals to identify the start of a trending move and to pick market tops and bottoms. The new variations in this article feature clusters of three ADX lines, three +DI lines, and three -DI lines instead of the original three lines.
Directional movement index
ADX signal: Average directional movement index (ADX) signals a trending market when the ADX (14 periods) is above level 20 and rising. But ADX itself does not indicate whether the market is trending up or down. That signal is provided by +DI and -DI.
After ADX has risen to the 50 level and turns down, its decline represents a retracement. If there was an uptrend previously, then the declining ADX signals a correction down. If there was a downtrend previously, then the declining ADX signals a correction up.
When ADX declines to below 20 again, the market is nontrending until it rises above 20. Then the market trends again (Figure 1).
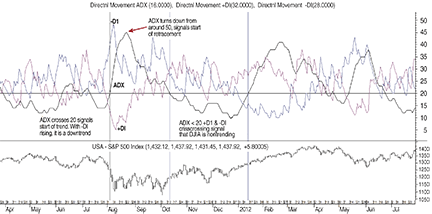
FIGURE 1: BASIC DMI SIGNALS: ADX, +DI, -DI. ADX signals a trending market when the ADX (14 periods) is above level 20 and rising. But ADX itself does not indicate whether the market is trending up or down. That signal is provided by +DI and -DI.
+DI & -DI Signals: The +DI and -DI indicates whether a market is trending up or down. When the ADX is rising above 20 and if +DI is positioned above ADX and rising, then the market is trending up. If ADX is rising above 20, and -DI is positioned above ADX and also rising, then the market is trending down.
Basically, when price rises, +DI will rise but -DI will fall. When price falls, -DI will rise, and +DI will fall. In other words, +DI and -DI are mirror images of each other.
In a strongly trending market, because the two DI lines mirror each other, the DI lines will move in opposite directions, thus opening up a sizable distance between them. In a congesting market, however, as price does not move strongly in either direction, the DI lines do not move away from each other; in fact, they tend to end up crossing each other (Figure 1).